Understanding the Data Behind an EPD
Environmental Product Declarations are designed to provide standardized, transparent environmental information. But open an EPD for the first time and you’re quickly met with declared units, life-cycle modules, system boundaries, impact categories, Product Category Rules and more than a few acronyms.
So where do you start?
Reading an EPD doesn’t require becoming a life-cycle assessment expert. It does require understanding the context behind the numbers.
The NCSPA Industry-Wide Environmental Product Declaration brings that level of transparency to corrugated steel pipe, providing standardized environmental information based on production data from participating CSP manufacturers across North America.
Understanding how to read the EPD reveals more than what the terminology means. It shows how CSP is manufactured, where environmental impacts occur, what data support the results and how environmental performance can be considered alongside other factors in infrastructure material selection.
Let’s walk through the EPD and see what the environmental data tell us about CSP.
1. Start With the Declared Unit
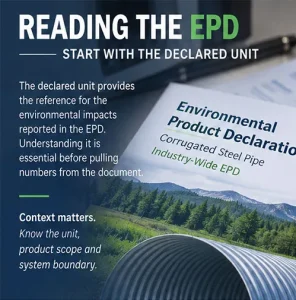
Before looking at an environmental impact value, first determine what that value represents.
The declared unit establishes the reference against which environmental impacts are reported. It gives the numbers in the EPD their measurement context.
For the NCSPA Industry-Wide EPD, the declared unit is one metric ton of corrugated steel pipe, excluding packaging. Because CSP is custom-made for specific projects and steel suppliers may vary, the assessment models a production-weighted average representing one metric ton of CSP across participating NCSPA member companies.
That means when you encounter an environmental result later in the EPD, such as kilograms of CO₂ equivalent, the value is being reported in relation to that one-metric-ton declared unit.
The declared unit is your reference point. Start there, and the numbers that follow have meaning.
2. Find the System Boundary
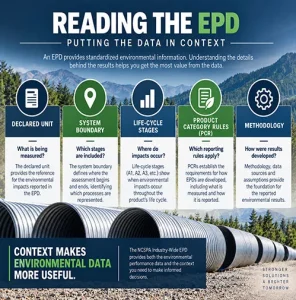
Next, determine which portions of the product’s life cycle are included in the assessment.
That’s the role of the system boundary.
Life-cycle assessments divide a product’s life into defined stages, from raw material acquisition and manufacturing through construction, use and eventual end of life.
The NCSPA EPD evaluates environmental impacts from raw material extraction through manufacturing and includes additional end-of-life modules.
Understanding those boundaries helps answer another important question:
“What processes are represented by these results?”
3. Decode the Life-Cycle Modules
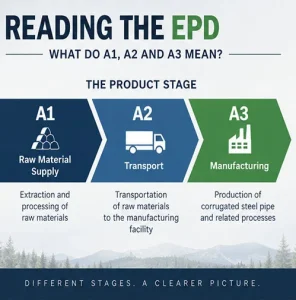
Now we can look more closely at those three modules.
For corrugated steel pipe, they aren’t simply abstract codes. They follow the product through its production process.
A1 includes raw material extraction and processing associated with steel production and coating upstream of NCSPA manufacturing facilities.
A2 includes transportation of those component materials from upstream steel manufacturing and coating operations to CSP production facilities.
A3 includes manufacturing the corrugated steel pipe itself, along with ancillary materials and packaging materials and their upstream production and transportation.
The production flow diagram in the EPD makes that progression particularly easy to see, tracing raw materials and steel processing through transportation and CSP manufacturing.
And when you reach the environmental results, those same A1, A2 and A3 columns show where impacts occur within that process.
4. Don’t Stop at Global Warming Potential
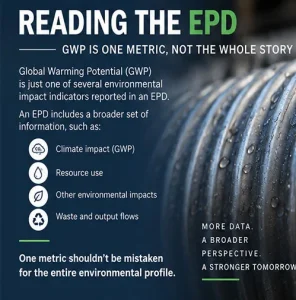
Global Warming Potential, or GWP, gets a lot of attention in conversations about environmental performance.
An EPD allows us to look deeper.
The NCSPA EPD reports environmental impacts separately across raw materials, upstream transportation and CSP manufacturing, allowing readers to see where impacts occur throughout the cradle-to-gate production process.
For Global Warming Potential, the EPD reports a total of 2,140 kg CO₂ equivalent per metric ton of average CSP across A1-A3. More importantly, the results show where that impact occurs: 88% is associated with raw material production in A1, compared with 5% for upstream transportation in A2 and 7% for manufacturing in A3.
The EPD’s interpretation identifies upstream material production, primarily the steel components, as the most significant contributor to the impact-category results.
That distinction gives the industry useful information about where environmental impacts are concentrated.
And GWP is only one part of the picture.
The CSP EPD also reports Acidification Potential, Freshwater and Marine Eutrophication Potential, Smog Formation Potential and Ozone Depletion Potential. Additional results provide information about renewable and non-renewable resources, freshwater use, waste flows and materials for recycling.
Together, these indicators provide a broader view of the environmental profile associated with CSP production than any one metric can provide.
5. Look Behind the Numbers
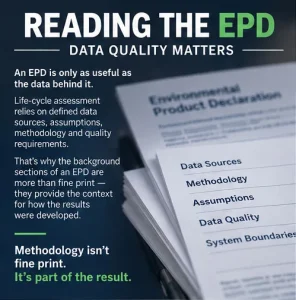
TThe results tables may get most of the attention, but some of the most important information in an EPD appears outside them.
The NCSPA EPD isn’t based on a hypothetical CSP manufacturing operation. Primary manufacturing data were collected from eight participating NCSPA member facilities, with approximately a full year of production data represented for each facility.
Those primary data are combined with documented secondary life-cycle inventory sources to model upstream processes and develop the environmental results reported in the EPD.
The assessment also evaluates data quality across time-related, geographical and technological coverage, as well as precision, completeness, representativeness, consistency, reproducibility, data sources and uncertainty. The document identifies its assumptions, allocation procedures, cut-off rules and underlying data sources.
That’s an important part of understanding the CSP results.
The numbers are supported by a documented methodology and actual production information from participating manufacturers.
Methodology isn’t fine print. It’s part of the result.
6. Understand the Product Category Rules
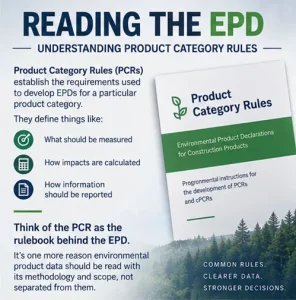
Here’s another acronym you’ll encounter when reading an EPD: PCR.
Product Category Rules establish requirements for developing EPDs for a particular category of products. They provide the framework for how an assessment is conducted and how environmental information is reported.
Think of the PCR as part of the rulebook behind the EPD.
The NCSPA EPD follows the Smart EPD Part A Product Category Rules for Building and Construction Products and Services and the Smart EPD Part B Product Category Rules for Designated Steel Construction Products. Its core standard is ISO 21930:2017, and the declaration conforms to ISO 14025, ISO 14040, ISO 14044 and ISO 21930.
The LCA and data also underwent external independent critical review, while the declaration and data were independently verified according to ISO 14025 and the applicable PCR.
In practical terms, the environmental information reported for CSP wasn’t developed according to a set of reporting rules created specifically by NCSPA. It was developed and reviewed within established standards and Product Category Rules governing how environmental information for this product category is assessed and reported.
That provides an important foundation for understanding the data
7. Put the Data in Context
At this point, we have everything we need to begin reading the CSP environmental results with context.
Declared Unit
The results represent one metric ton of corrugated steel pipe, excluding packaging.
System Boundary
The assessment is cradle-to-gate, covering the product stage through manufacturing.
Life-Cycle Modules
A1 covers raw material extraction and processing, A2 covers transportation to the manufacturer, and A3 covers CSP manufacturing.
Product Category Rules
Established PCRs provide requirements for how the assessment is developed and reported.
Methodology
The EPD documents its data sources, assumptions, calculation methods, allocation procedures and data-quality considerations.
Now a value in an environmental performance table isn’t just a number.
We know what it measures, which stages of CSP production it represents, where the impacts occur and the framework under which it was calculated.
That’s the difference between simply finding environmental data and understanding it.
8. What Does “Industry-Wide” Mean?
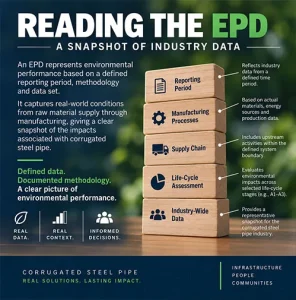
One of the strengths of an industry-wide EPD is the breadth of production it can represent.
The NCSPA declaration brings together CSP production data from eight participating manufacturing facilities across North America: TrueNorth Steel, Pacific Corrugated Pipe, Contech Engineered Solutions, J&J Drainage, Lane Enterprises, Metal Culverts, Jensen Bridge and Southeast Culvert.
Rather than representing the environmental profile of one individual facility, the results are calculated as a production-weighted average across the participating manufacturers.
The assessment also reflects both major steelmaking routes represented in the CSP supply chain. Electric Arc Furnace production accounts for 59% of the represented production route and Basic Oxygen Furnace production accounts for 41%.
Recycled content is another part of that material story.
While the exact pre- and post-consumer recycled content of the CSP could not be quantified, the EPD uses information provided by upstream steel mills through their EPDs and North American average recycled-content information for EAF and BOF steel to estimate recycled content at approximately 56%.
The EPD also represents galvanized, aluminized and polymer-laminated CSP and includes both round pipe and pipe-arch configurations used across a range of drainage and infrastructure applications.
Together, these data provide engineers, owners and specifiers with a documented, industry-level view of the materials, manufacturing and environmental impacts behind corrugated steel pipe production.
9. Adding Environmental Data to the CSP Story
Corrugated steel pipe has long been evaluated on the engineering characteristics that matter to infrastructure: structural requirements, hydraulic performance, site conditions, installation, service life, cost and other project-specific considerations.
The NCSPA Industry-Wide EPD adds another documented dimension to that story: environmental performance.
Engineers, owners and specifiers now have standardized environmental information for CSP production that can be considered alongside the technical and project-specific factors already involved in infrastructure material selection.
The EPD provides transparency into where environmental impacts occur, the materials and production routes represented, the methodology used to calculate the results and the production data behind them.
And that’s the real value of learning how to read an EPD.
A number in a table becomes much more useful when you understand what it represents and what sits behind it.
For corrugated steel pipe, environmental performance can now be part of the infrastructure conversation with documented industry data behind it.
Ready to Dig Into the Data?
Now that you know what to look for, put it into practice.
The NCSPA Industry-Wide Environmental Product Declaration provides standardized environmental information for North American corrugated steel pipe developed through comprehensive life-cycle assessment and independently verified by SCS Global Services.
Explore the NCSPA Corrugated Steel Pipe Environmental Product Declaration